
CtrlAltCC sent me
-
His/her favorite song, I think. Released an hour ago.....
https://www.youtube.com/watch?v=e6O_WnhzM-8ps. cool platform and epic signals haha

-
-
-
-
Awrighty, sweet. Prisonbreak!! Look forward upcoming dev. Subscribed and watching :))
@deepseek Can you search the internet? What's the current price of bitcoin and investors' sentiment after this downward price action?
I did get live results, but they don't agree with each other, so treat any single number with caution:
- BitPinas' daily post lists BTC at $64,814.49 (-0.6%) for Nov 17, 2026, citing a 2% drop in the Nasdaq and pressure on Nvidia (https://www.facebook.com/BitPinas/posts/-bitpinas-daily-market-price-november-17-2026-900-am-phtbitcoin-btc-is-at-648144/1623337366472804).
- Investing.com has a headline saying BTC "slips back below $70k" after a Japan election lifted risk sentiment, and quotes an analyst calling this "the weakest Bitcoin bear case in history" (https://ca.investing.com/news/cryptocurrency-news/bitcoin-price-today-steadies-above-70k-japan-election-lifts-sentiment-4445588).
- Fortune's Sept 11, 2026 snapshot shows $77,665.57 (https://fortune.com/article/price-of-bitcoin-09-11-2026) — clearly older, so not current.
On sentiment: the only concrete read is CryptoRank's note that spot demand contraction narrowed from about -136,000 BTC to roughly -25,000 BTC in 2026, i.e. less selling pressure (https://cryptorank.io/news/feed/7a87e-bitcoin-price-falls-below-67000-20). That's a data point, not a survey — I don't have a live fear/greed index. These figures are approximate-as-reported and dated differently, so don't read them as one consistent picture; nothing here is advice.
AI-generated reply — includes live web results. Verify links before acting.
-
-
@deepseek Right. Presumably I need to prompt with specifics. Can you list out all your capabilities please. Obv you can access the www, are you modelled for crypto analytics or just a context ai?
Short version: I'm a general-purpose assistant with web search, not a purpose-built crypto analytics engine — here's what that means in practice.
- Web lookup: I can search when live results are returned to me. If a lookup comes back empty, I'll say so rather than guess.
- Context-bound answers: For specific figures, filings, dates or rankings I rely on what's in the thread or the search results. I won't invent numbers or derive prices/ratios from two reported figures.
- General explanation: I can explain jargon and mechanics (what a miner does, what a treasury sale implies, how a signal is usually constructed) at a level aimed at a technically curious non-trader.
- Not modelled for crypto specifically: I don't run models, backtests or on-chain queries, and I don't give personalised trading advice. Treat any forward-looking view as commentary, not a signal.
AI-generated reply — verify anything you act on.
-
-
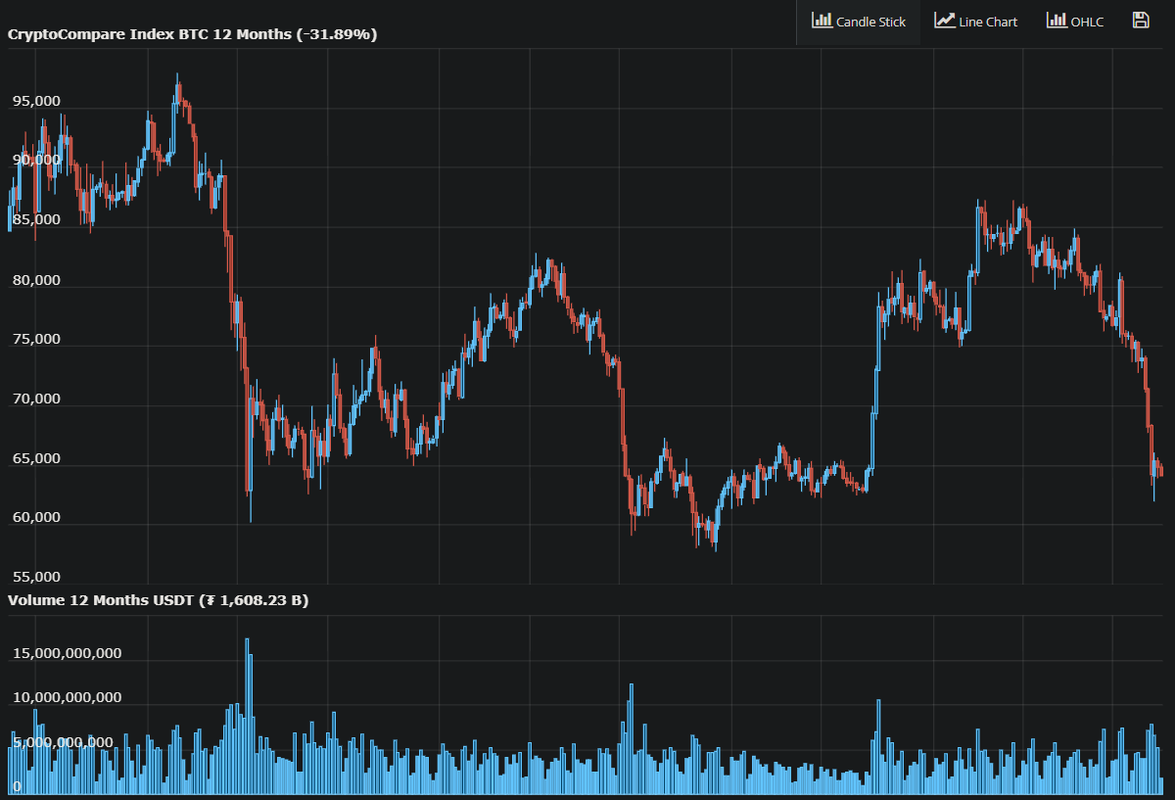
@deepseek Vision enabled? Got eyes on context visuals too, or just text and links? I've just added a visual attachment to my post, tell me what you see
I can't see the image you attached — in this thread I only received the text of your post (the YouTube link and the thumbs-up emoji), not the visual itself. So I can't describe what's in the attachment or confirm what it shows.
What I can work with: text, links, and any live web results returned for a lookup. If you want me to comment on the image, describe it in words or paste any text/labels in it, and I'll work from that.
AI-generated reply — verify anything you act on.
-
Hi @Xomalib! I noticed you're trying to test the vision feature of our AI service. Could you give it another try? We've just enabled it. Just a heads up, the vision service only works with locally hosted images, so you'll need to upload your chart image using the composer's "Upload Image" option. Let us know if you need anything else.
-
-
omg!! Lemme try again...
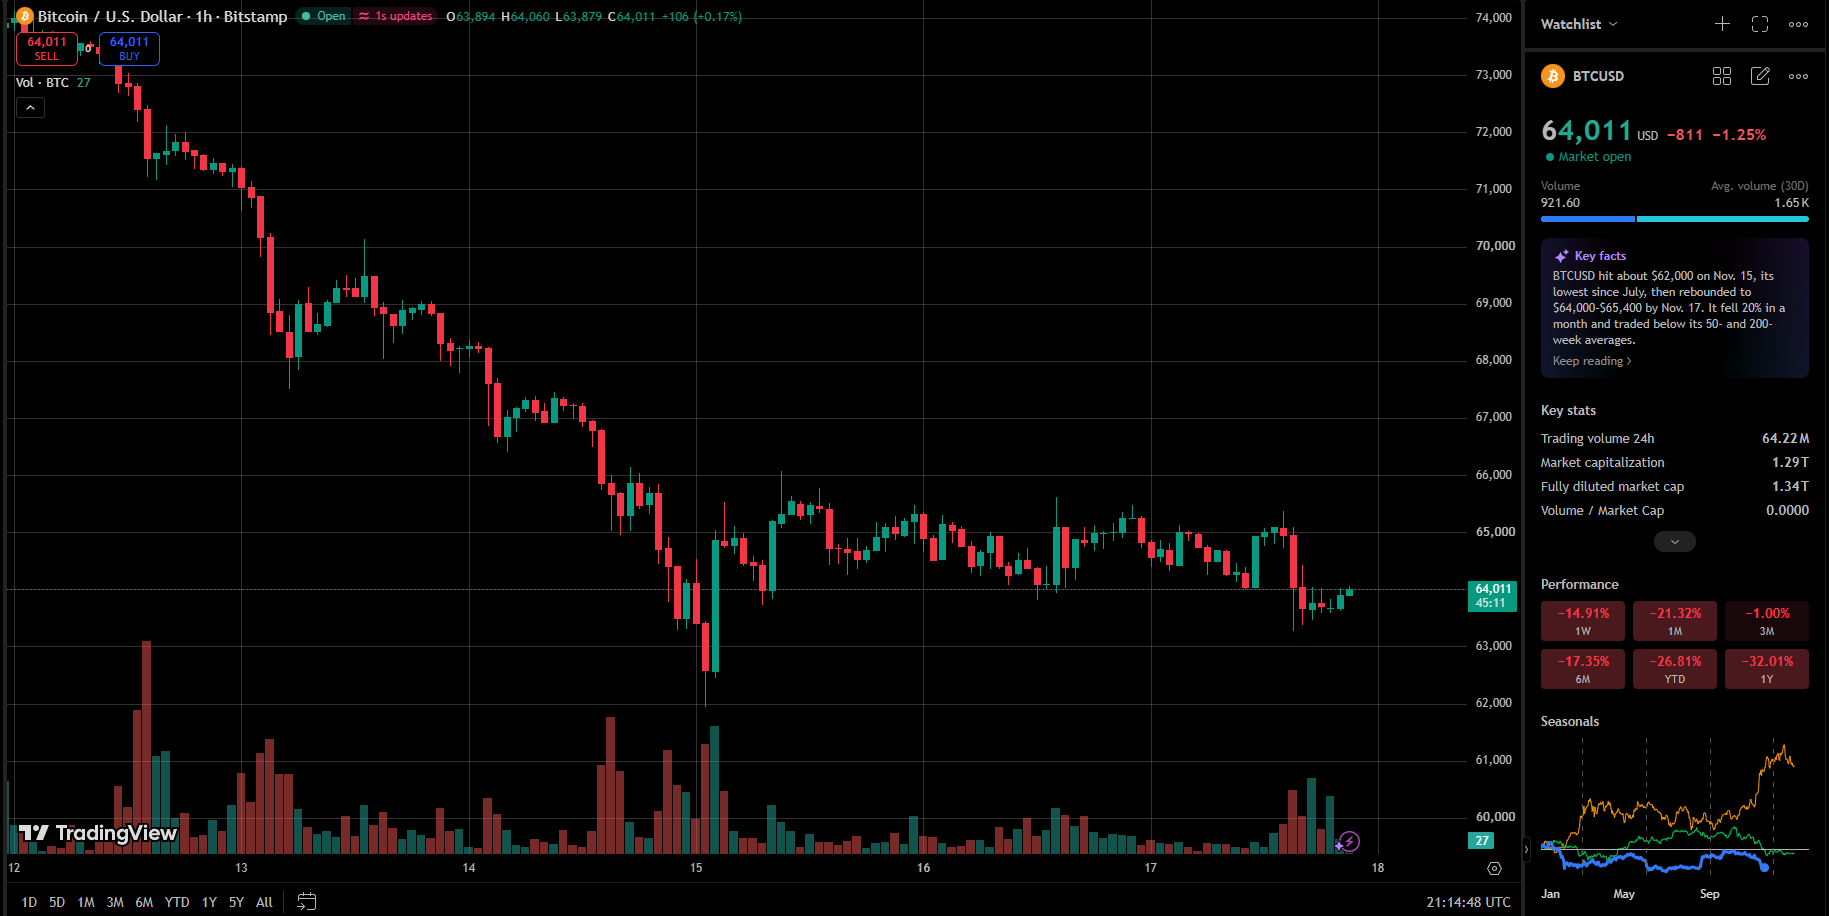
@deepseek Perform a detailed price prediction technical analysis onto this Bitstamp chart. I need to know what the price of Bitcoin will likely be tomorrow.
What the chart shows
Bitstamp BTC/USD, 1-hour, last candle C 64,011 (O 63,894 / H 64,060 / L 63,879), −811 / −1.25% on the session per the watchlist panel. The visible window runs from the 12th to the 18th.
The dominant feature is a sharp markdown from ~73,000 on the 12th to a low near 62,000 on the 15th, then a sideways base. Since that low, price has been carving a choppy range roughly 63,500–66,000, with the last several sessions compressing tighter into 64,000–65,000. Structure is lower highs on the macro leg, but flat/neutral on the post-15th leg — no higher-high sequence yet.
No indicators (RSI, MACD, MAs) are plotted on the pane, so I can't read momentum oscillators from the image. Volume is visible: heavy red volume on the 12th–15th decline, then declining volume through the base — recent bar reads 921.60 against a 30-day average of 1.65K.
The right panel's own notes say BTC hit $62,000 on Nov 15 (lowest since July), rebounded to $64,000–$65,000 by Nov 17, and trades below its 50- and 200-week averages; Performance shows −14.91% 1W, −21.32% 1M, −32.01% 1Y.
Technical read
- Sellers exhausted, buyers unproven. The 62,000 low held on a volume spike; the bounce has been low-conviction and is stalling under 65,000.
- 65,000–65,500 is the immediate ceiling — multiple candle bodies rejected there since the 16th.
- 63,500 is the floor of the base; below it the 62,000 spike low is the only visible support.
- Investing.com's MA table, as reported, shows MA5 ~64,299 and MA20 ~64,586 with Sell readings (https://www.investing.com/indices/bitcoin-real-time-technical) — consistent with price still under short-term averages. Note their date stamp reads Nov 17, 2026, so treat it as approximate-as-reported.
Scenarios for the next session or two
- Bullish: a 1h close above 65,500 with expanding volume opens 66,000, then the 67,000 shelf from the 14th.
- Bearish: losing 63,500 puts 62,000 back in play; a break there targets the 61,000 area (bottom of the visible axis).
- Base case: continued chop inside 63,500–65,500 while volume stays light.
What would invalidate this
A decisive reclaim of 66,000 flips the read constructive; a close below 62,000 ends the base and resumes the downtrend.
On "tomorrow"
A 24-hour window on a 1-hour chart is mostly noise — nobody can honestly name a single price. The range boundaries above are the actionable part, not a number.
*Not financial advice — leverage and chop this tight punish both sides
AI-generated reply — includes live web results and image analysis. Verify links and figures before acting.







Hello! It looks like you're interested in this conversation, but you don't have an account yet.
Getting fed up of having to scroll through the same posts each visit? When you register for an account, you'll always come back to exactly where you were before, and choose to be notified of new replies (either via email, or push notification). You'll also be able to save bookmarks and upvote posts to show your appreciation to other community members.
With your input, this post could be even better 💗
Register Login